Oct. 6, 2021
A Retrospective Examination of My Personal Concert Log
IntroductionTwo of my longstanding favorite things are music and data. At the intersection of these interests exists a personal concert log. I began tracking the data from every concert starting with my first concert in August 2005–The Mars Volta opening for System of a Down. I was a junior in high school at the time. While my taste in music has changed over the years, I’ve always kept the practice of tracking data after every show. The concert log now contains over 120 concerts, spanning more than 15 years.
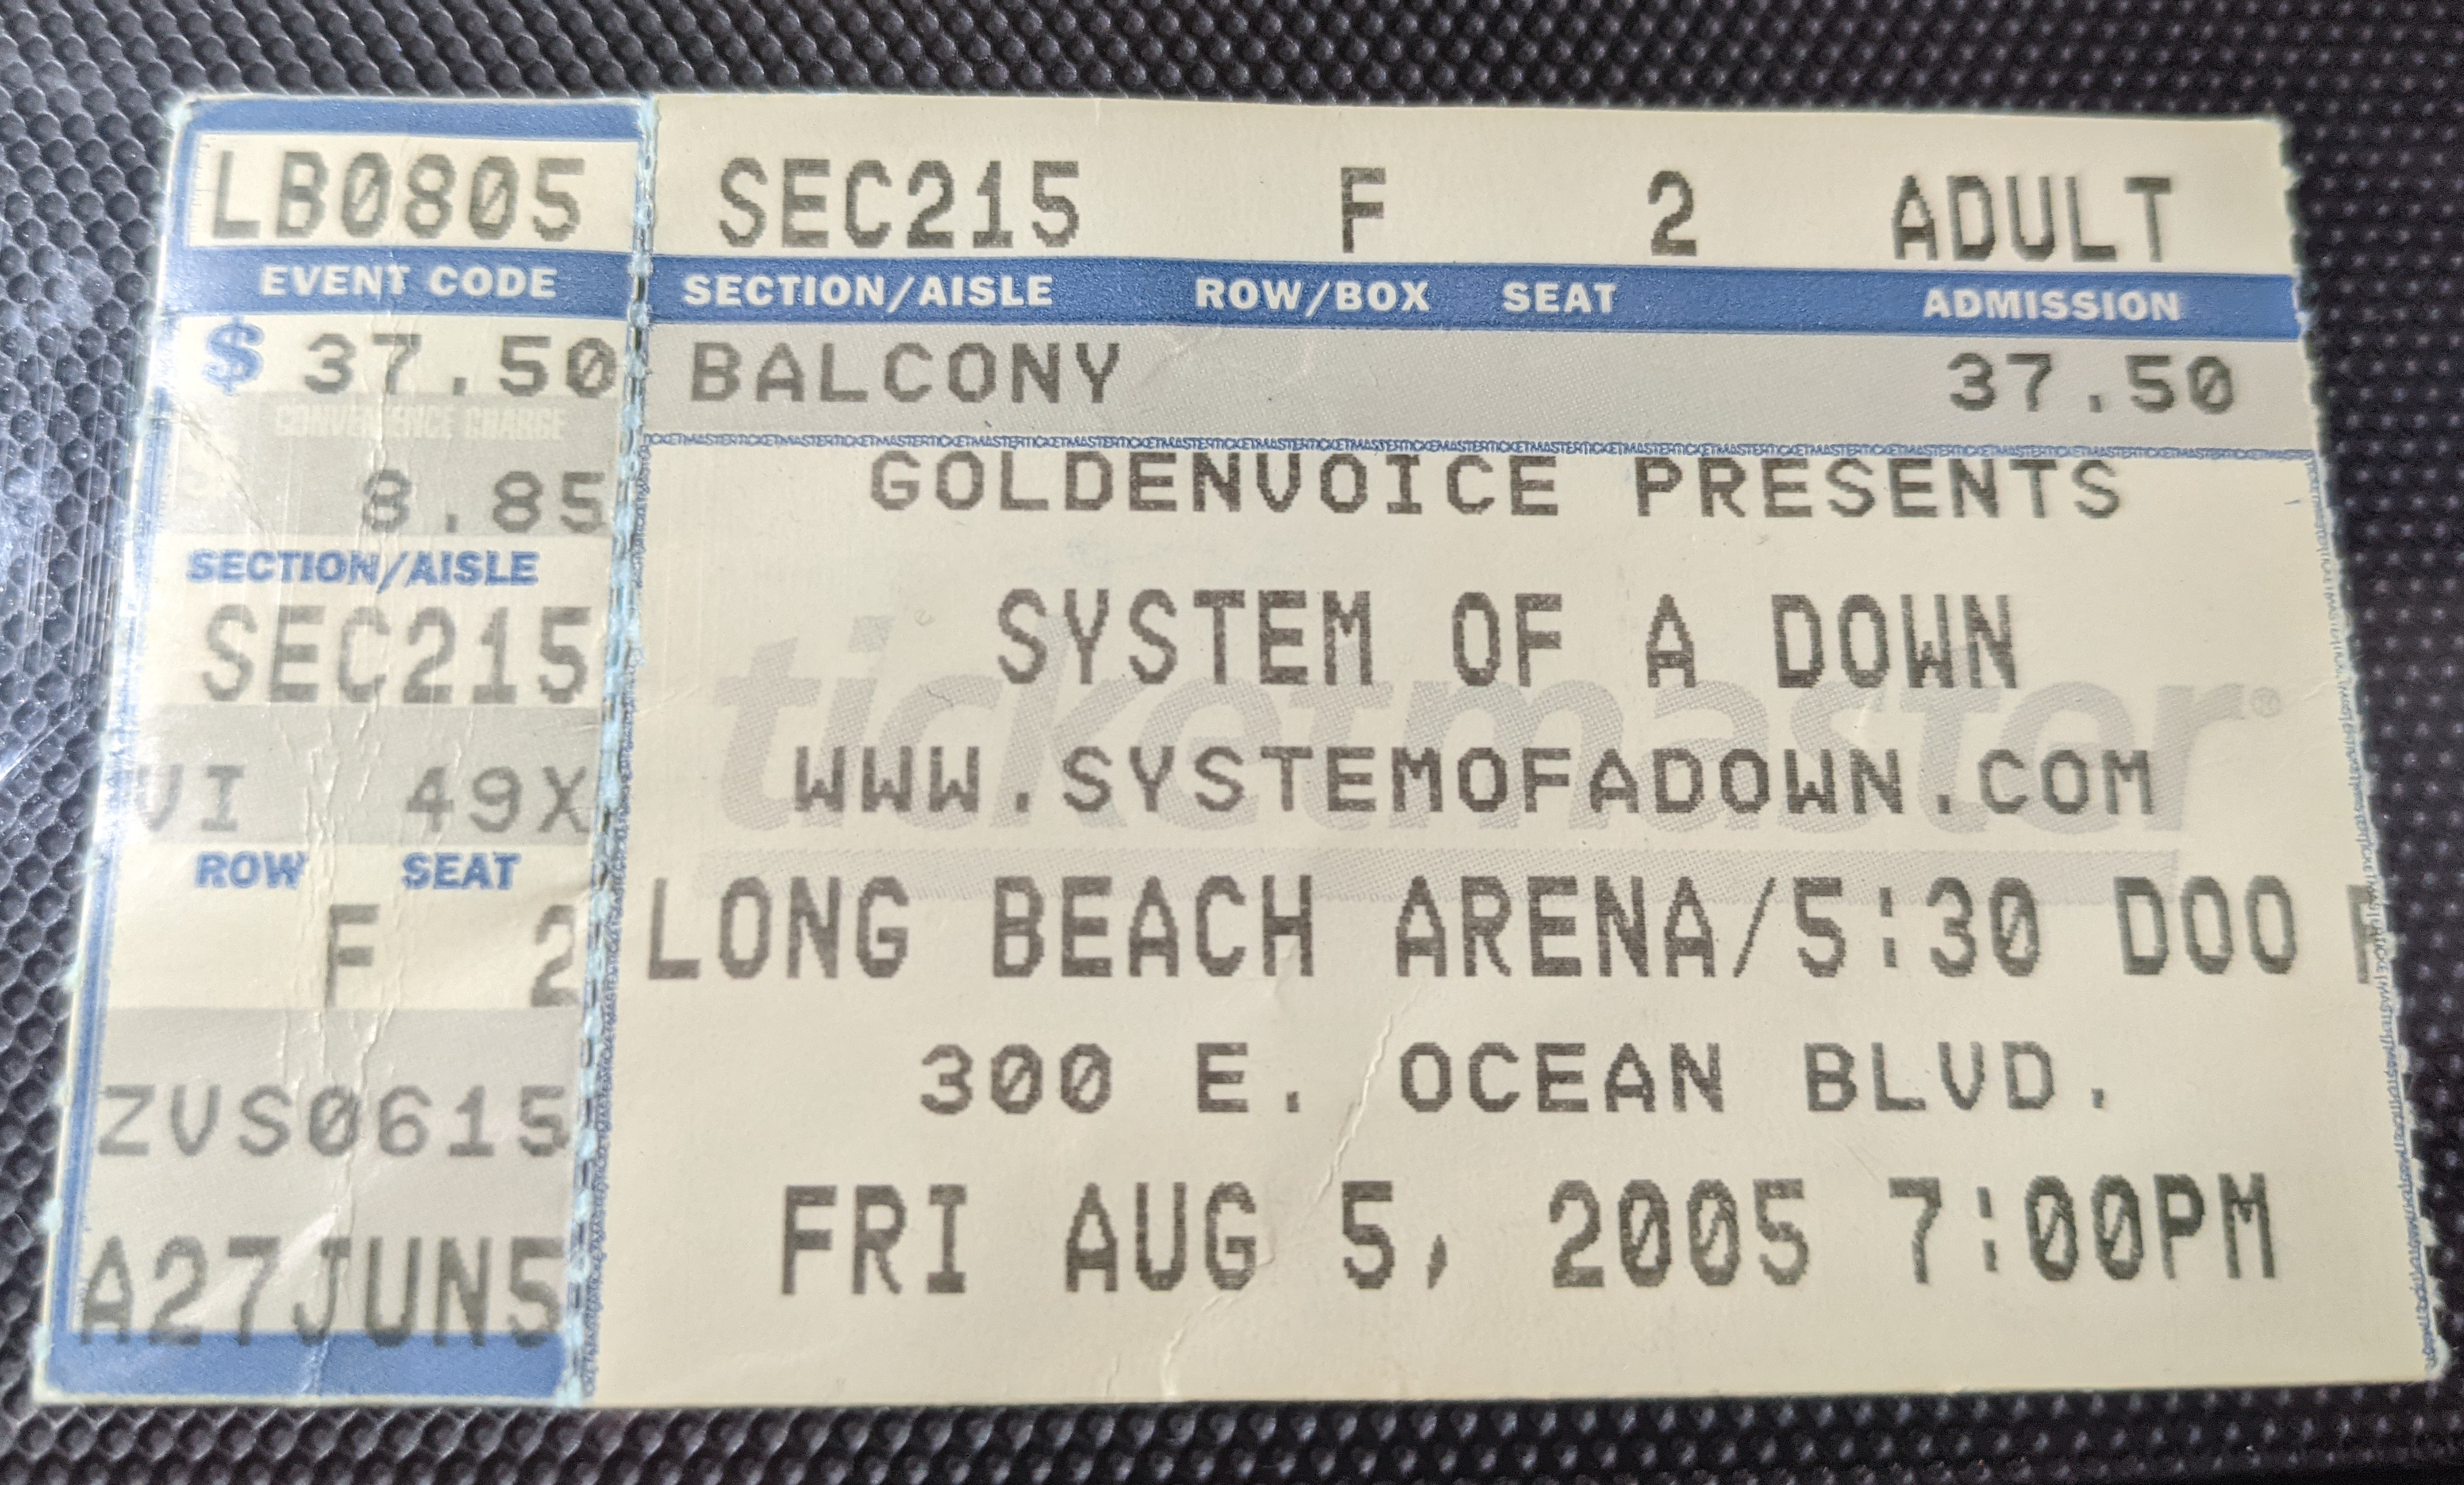
My first ticket stub. I have most of them saved in a book.
The Data
After every concert I write down basic information about the show including the date, location (venue & city), list of performing artists, and who I went to the show with. I’ll also add the setlist of any of the acts if I can find it online afterwards.
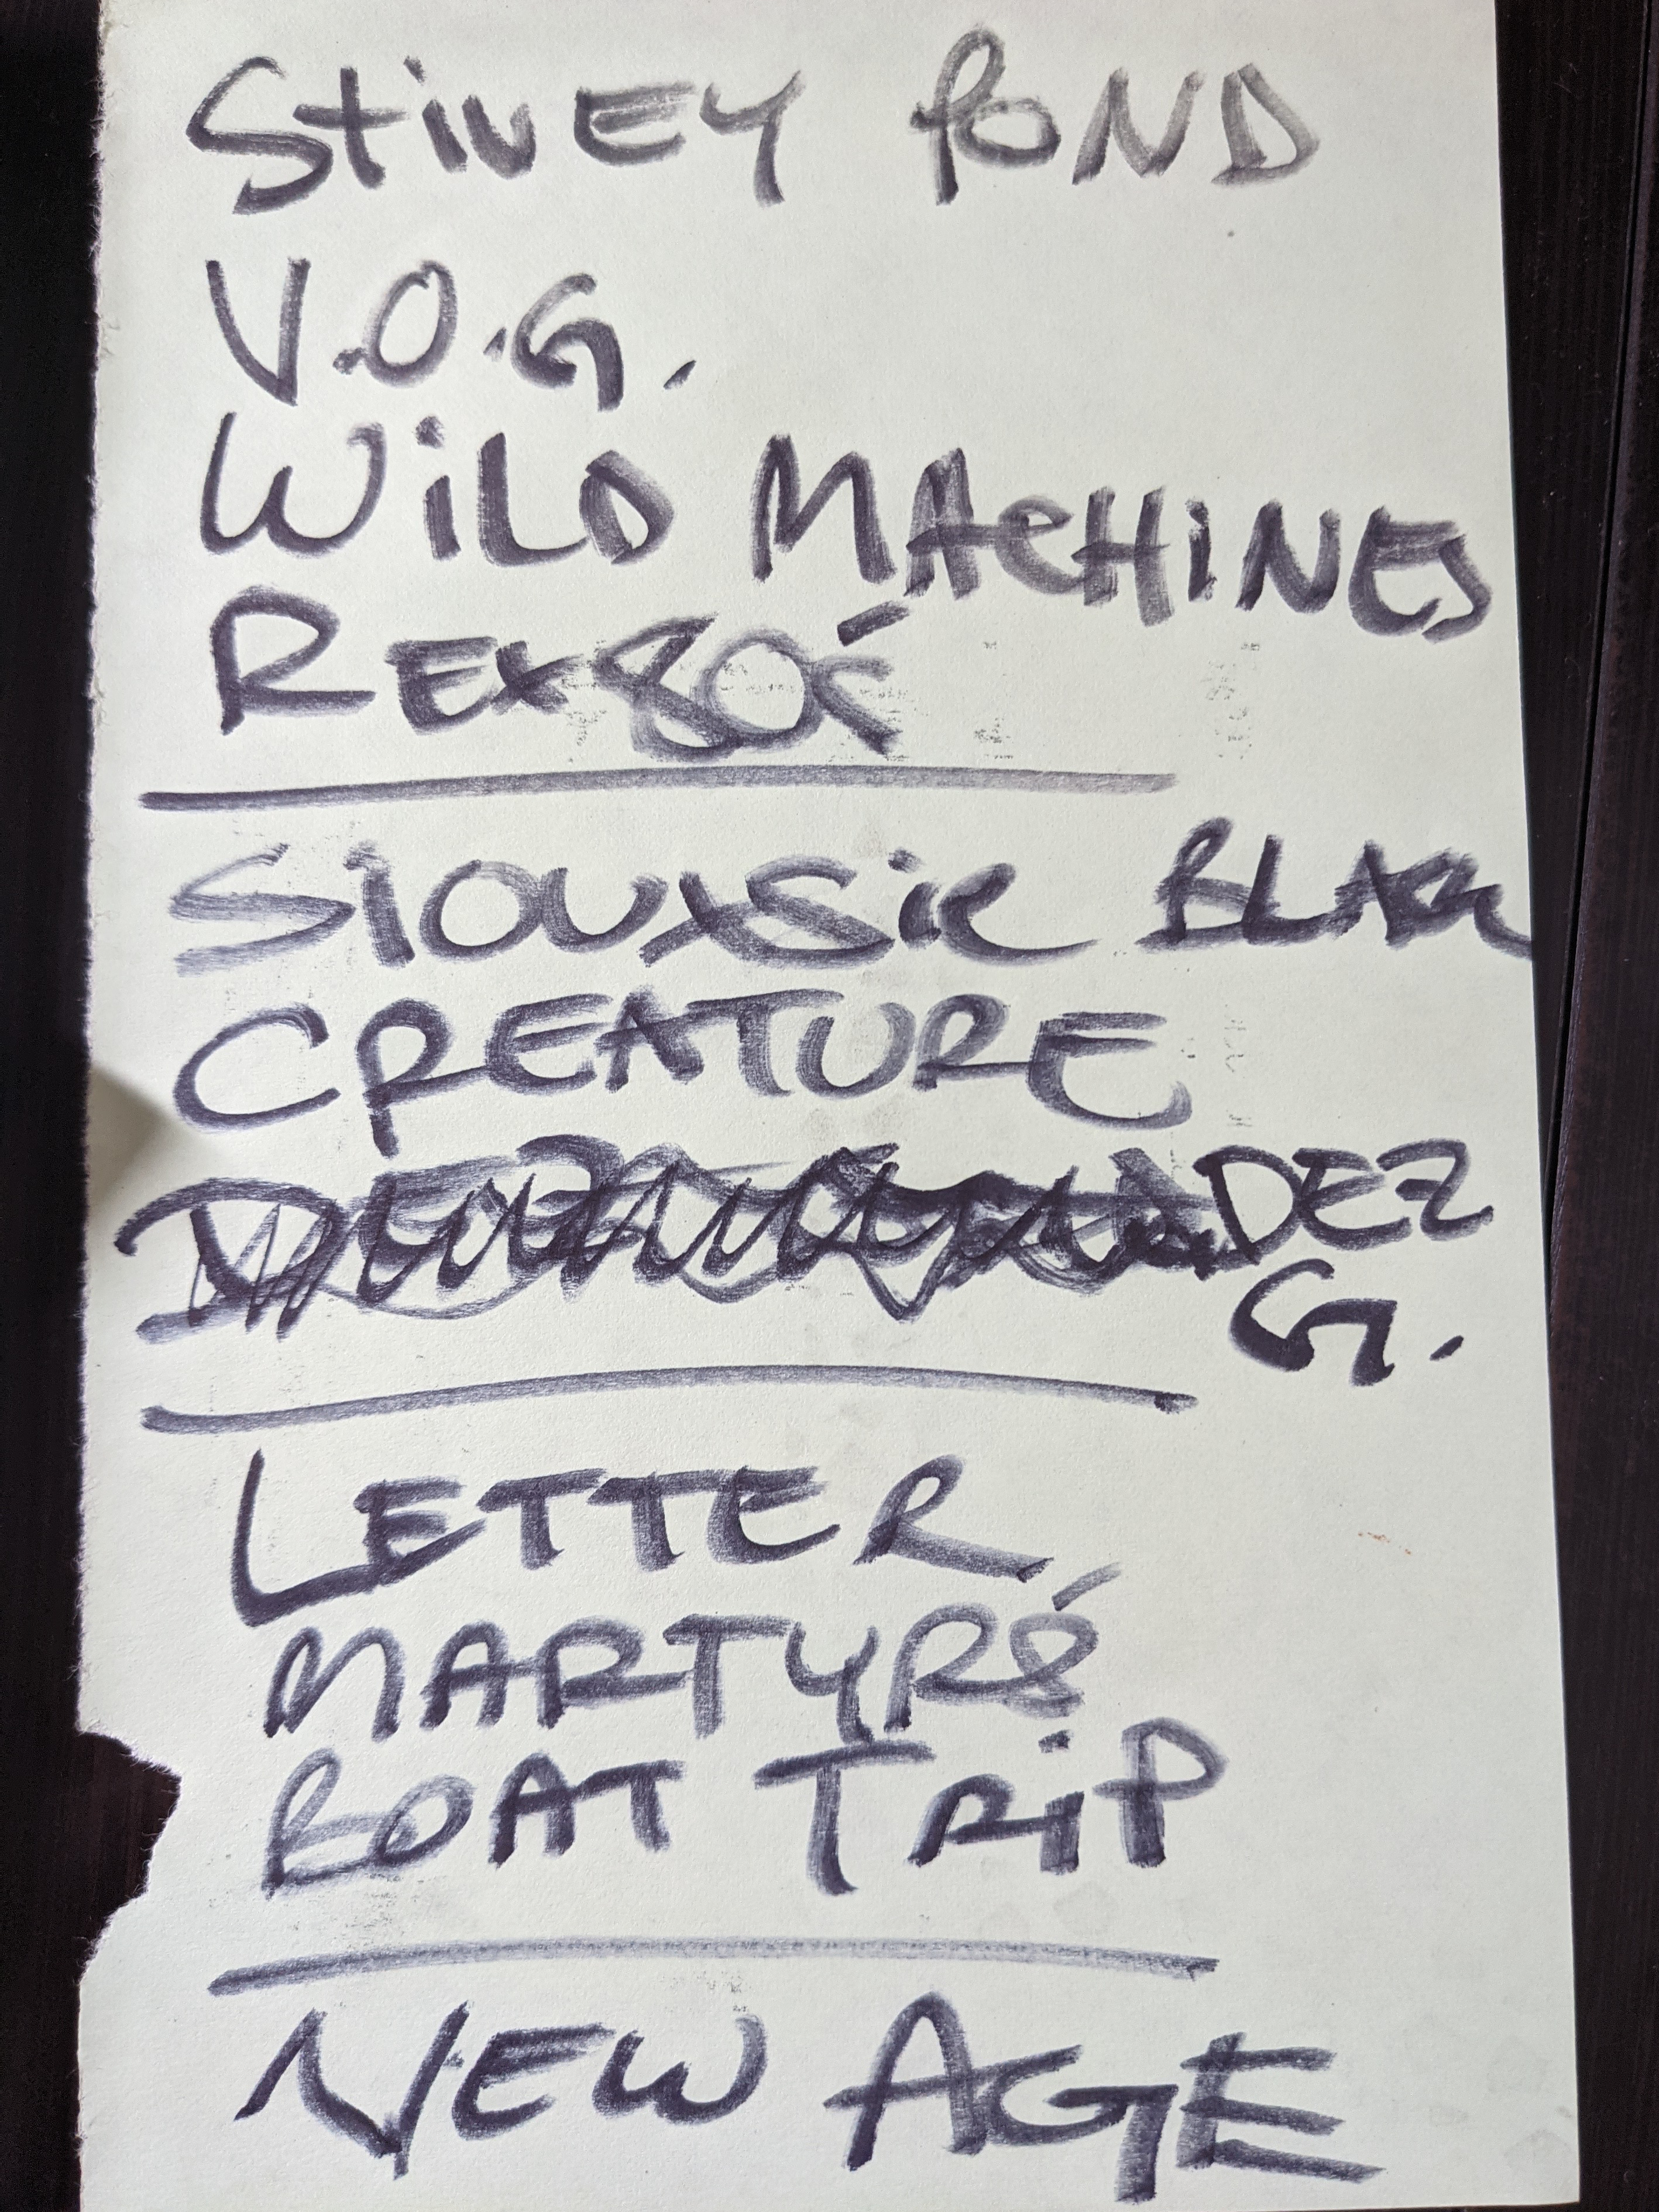
Although occasionally you might get the actual physical setlist if you’re lucky. This one is from Sleepy Sun.
Basic Descriptive Statistics
I’ve seen 300 artist performances, at 122 separate concert events, comprising 248 unique artists.
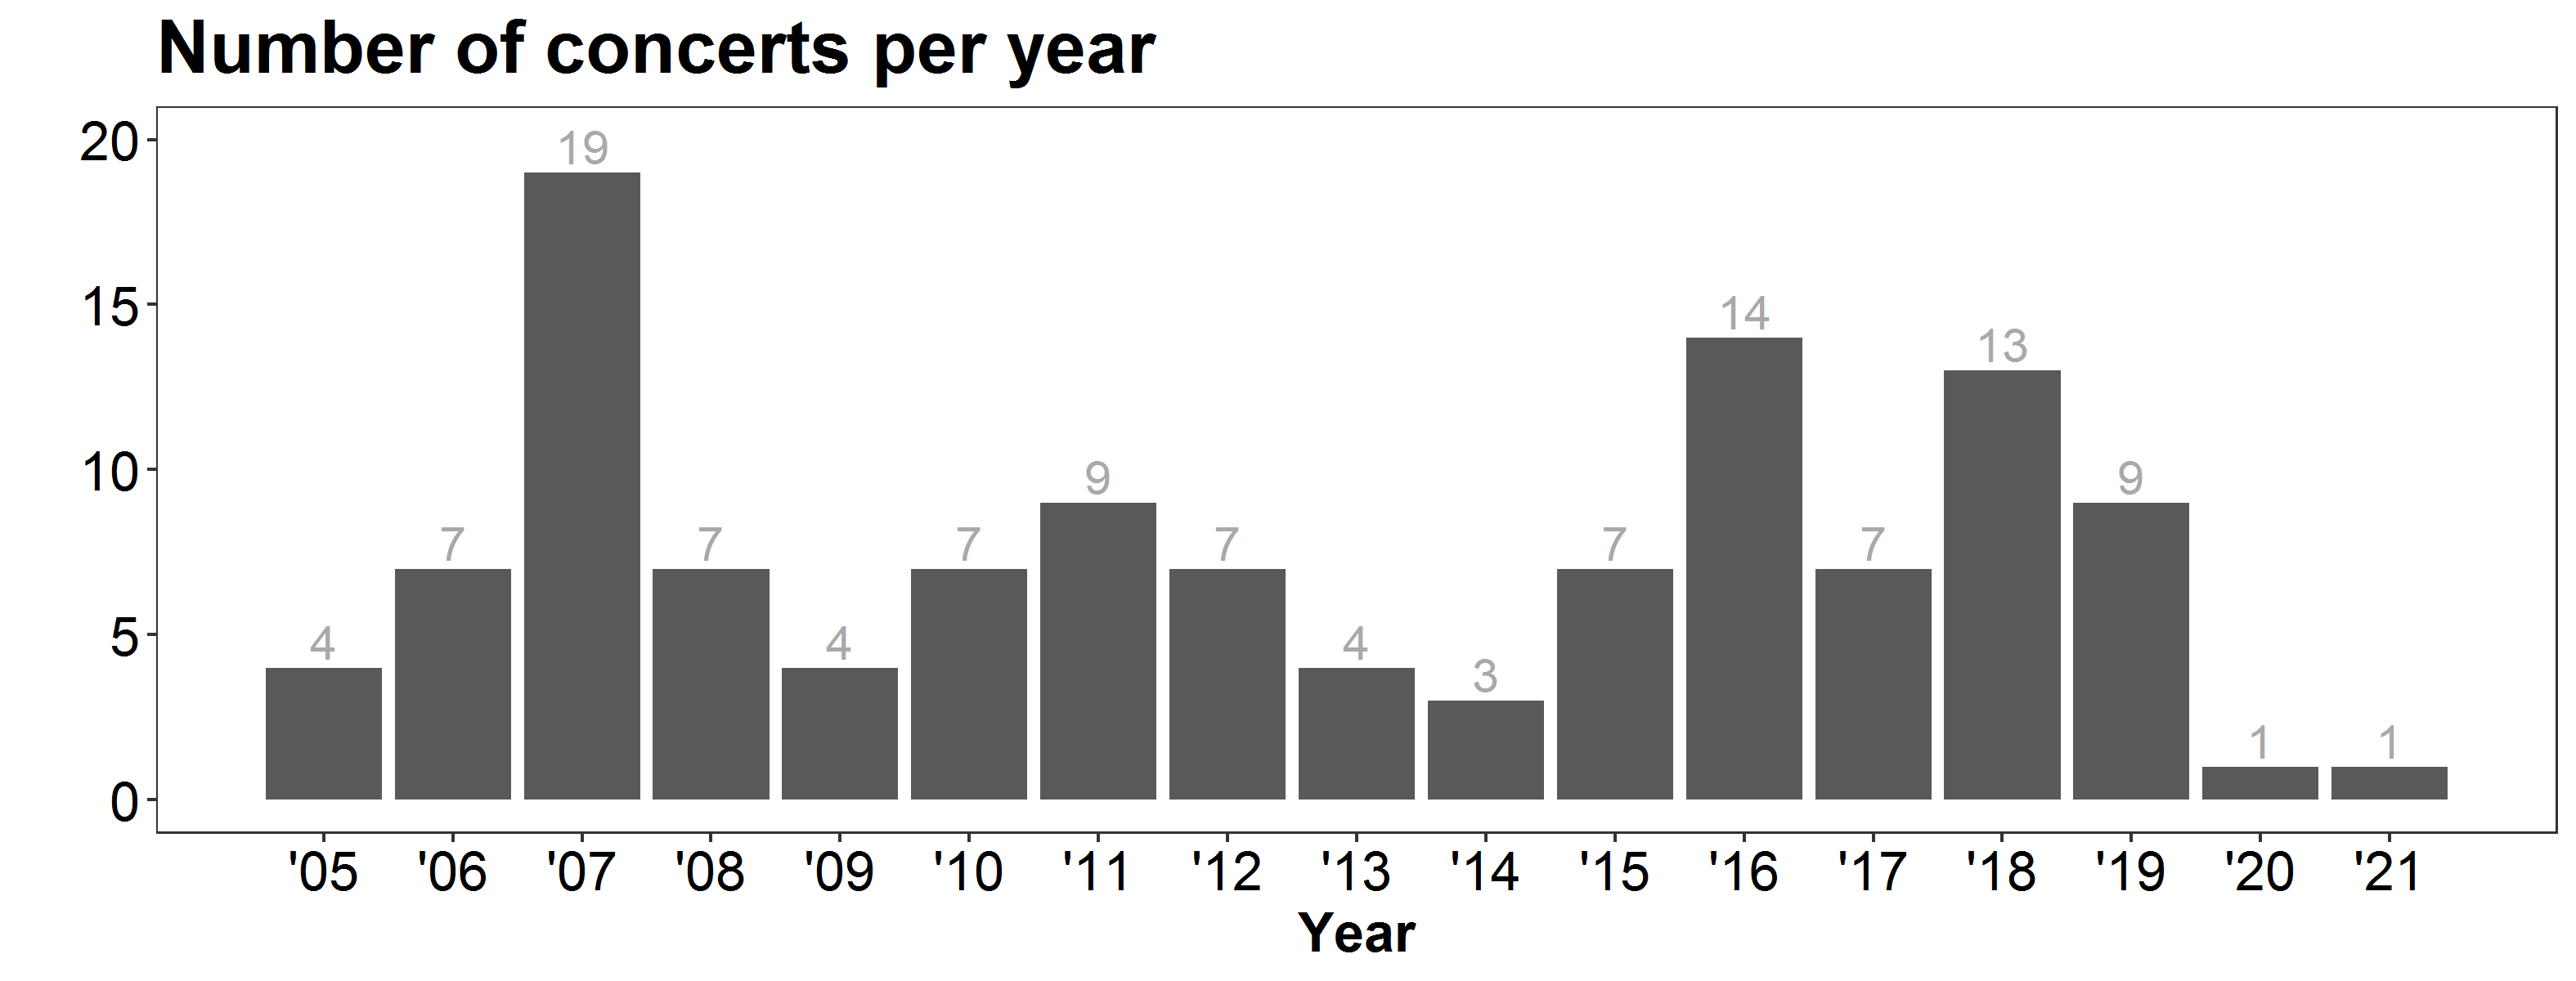
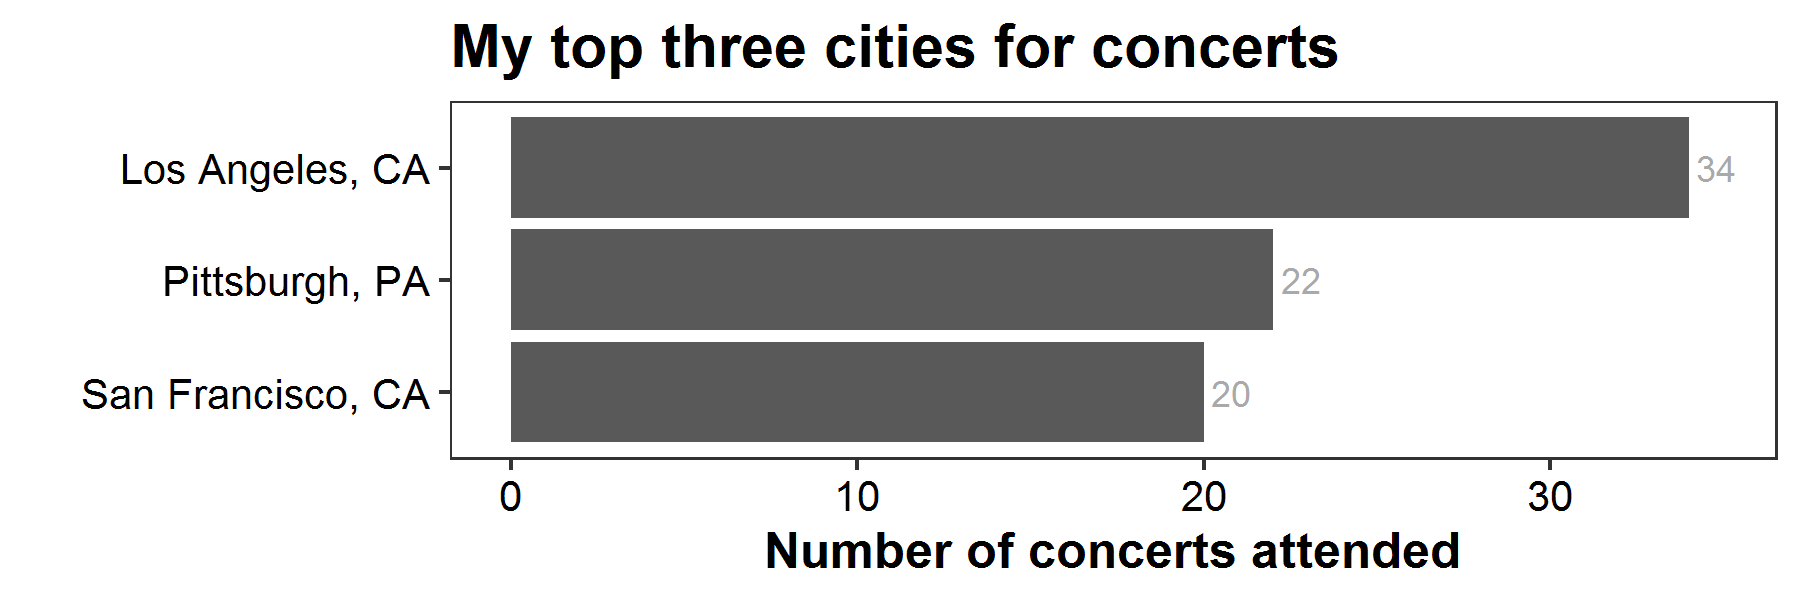
Where were most of the concerts?
What concert venues have I visited the most?
| The Echo + Echoplex (Los Angeles, CA) | ||
| Mr. Small’s Theatre (Pittsburgh, PA) | ||
| The Wiltern (Los Angeles, CA) | ||
| Hollywood Bowl (Los Angeles, CA) | ||
| The Independent (San Francisco, CA) | ||
| Heinz Hall (Pittsburgh, PA) | ||
| Pacific Amphitheatre (Costa Mesa, CA) | ||
| The Music Box (Los Angeles, CA) |
Genre Investigation
I was curious if I could create a visualization of how the genres of the concerts I attended changes over time. To help with tagging genre data for every artist, I used a web scraping tool (lastfmR) in R to grab the top 5 genre labels for every artist from last.fm. This eased the process, although I still ultimately hand coded each artist based on my own (biased) assessment of what genre label best fit. I tried to use more general, or “higher-level,” genre labels to reduce the count.
I limited the genres to only the top 6. Additionally, I only counted the genre of the headlining artist for each concert. I figured this was more representative of what attracted me to the concert. After applying the above filters, 71%, or 87 of the 122 headlining artists I’ve seen, are included in the figure below.
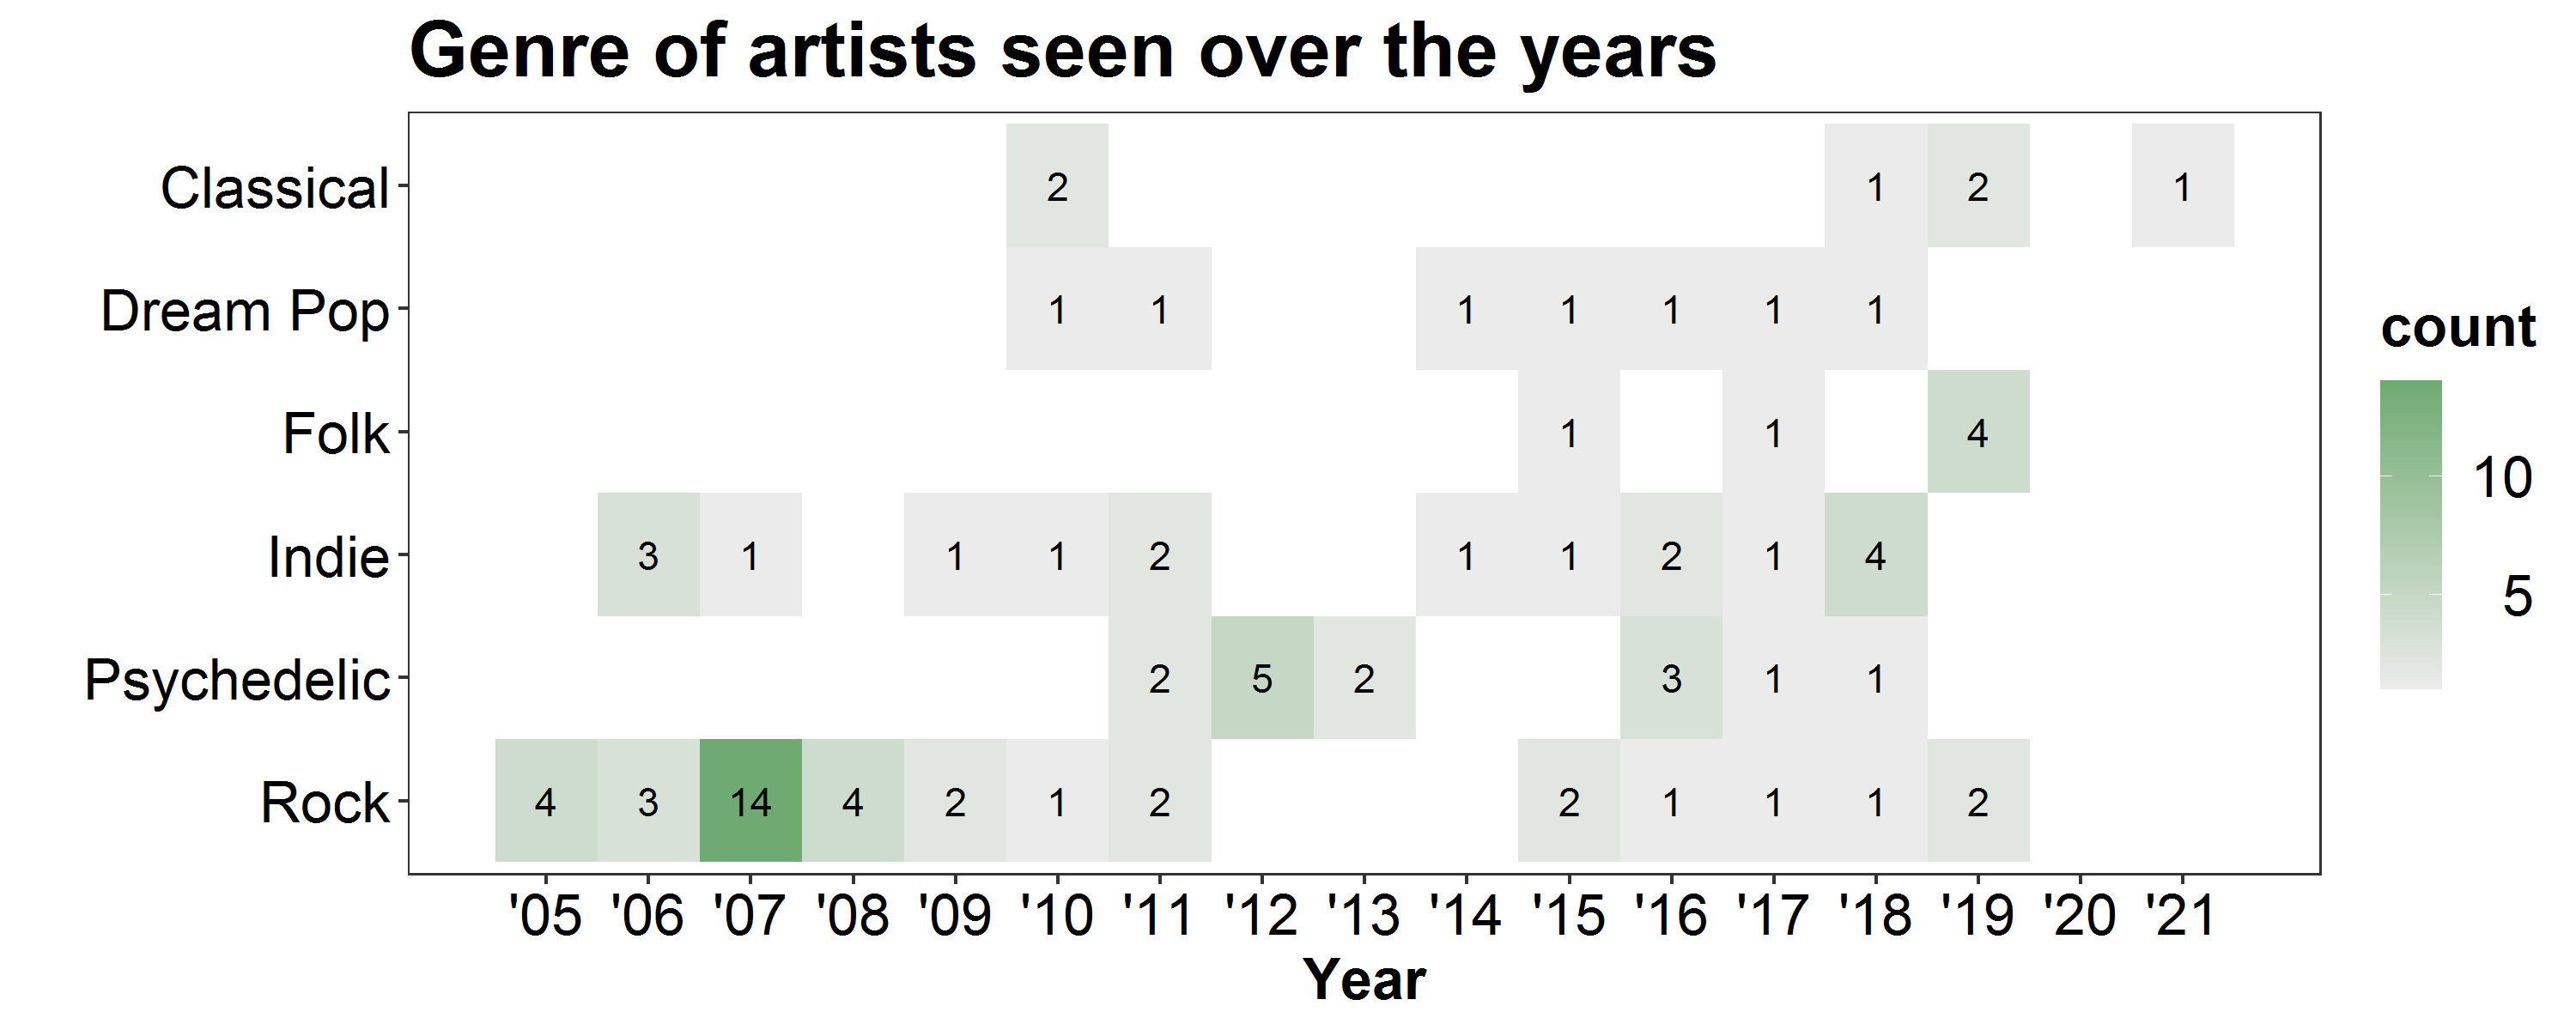
Only my top six genres were included. Cell values are counts of the genre for a concert’s headlining artist.
The above figure offers one way of seeing how my concerts have shifted from being predominately indie/rock to a wider mix of genres. This fact is somewhat obscured by only including the top 6 genres. However, the larger heat map with all genres was a bit overwhelming to look at and had lots of white (empty) space.
Concluding Thoughts
Although the data and figures presented here offer an interesting glimpse into my concert history, it’s hard to capture and express the richness of the experiences in full. Every concert has its own story. Maybe the night ended at a diner, where we ate greasy food, reliving the best moments of the concert and laughing about things we had seen. Almost certainly a good time was had with good people and good music.
At the time of writing this I have seen exactly 300 concert performances. So (don't stop me now), here’s to the next 300.