Jun. 28, 2019
Electricity Usage and Weather: A Personal Examination
My utility company provides energy usage reports at the end of every billing report for its customers. I thought it would be interesting to examine how my energy consumption varies throughout the year.
I gathered my reports (22 billing cycles in total) and created a dataset. The data was organized at the individual bill level (roughly corresponding to each month).1 I included the date range for each bill, bill amount, and electricity used (measured in kWh).
After briefly examining my electricity data it became clear that there were patterns based on season. I thought it would be interesting to examine how the weather might be influencing my energy consumption behavior.
I came across this wonderful website maintained by the National Oceanic and Atmospheric Administration (NOAA) that allowed me to submit a request for my local weather.2 I was quickly emailed a dataset with various weather data points (humidity, visibility, dry bulb temperature, etc). The measurements were gathered from our local Pittsburgh Weather Station (a part of NOAA’s National Weather Service).
I thought dry bulb temperature would be the best candidate for measuring the effect of weather on how much electricity I use (although humidity probably matters to some extent as well). I first aggregated the temperature data from its hourly measurements into a single daily average. I then mapped what days belonged to which of the 22 billing cycles (and excluded all other days). The average daily temperatures were then aggregated into a single average temperature for each billing period.3
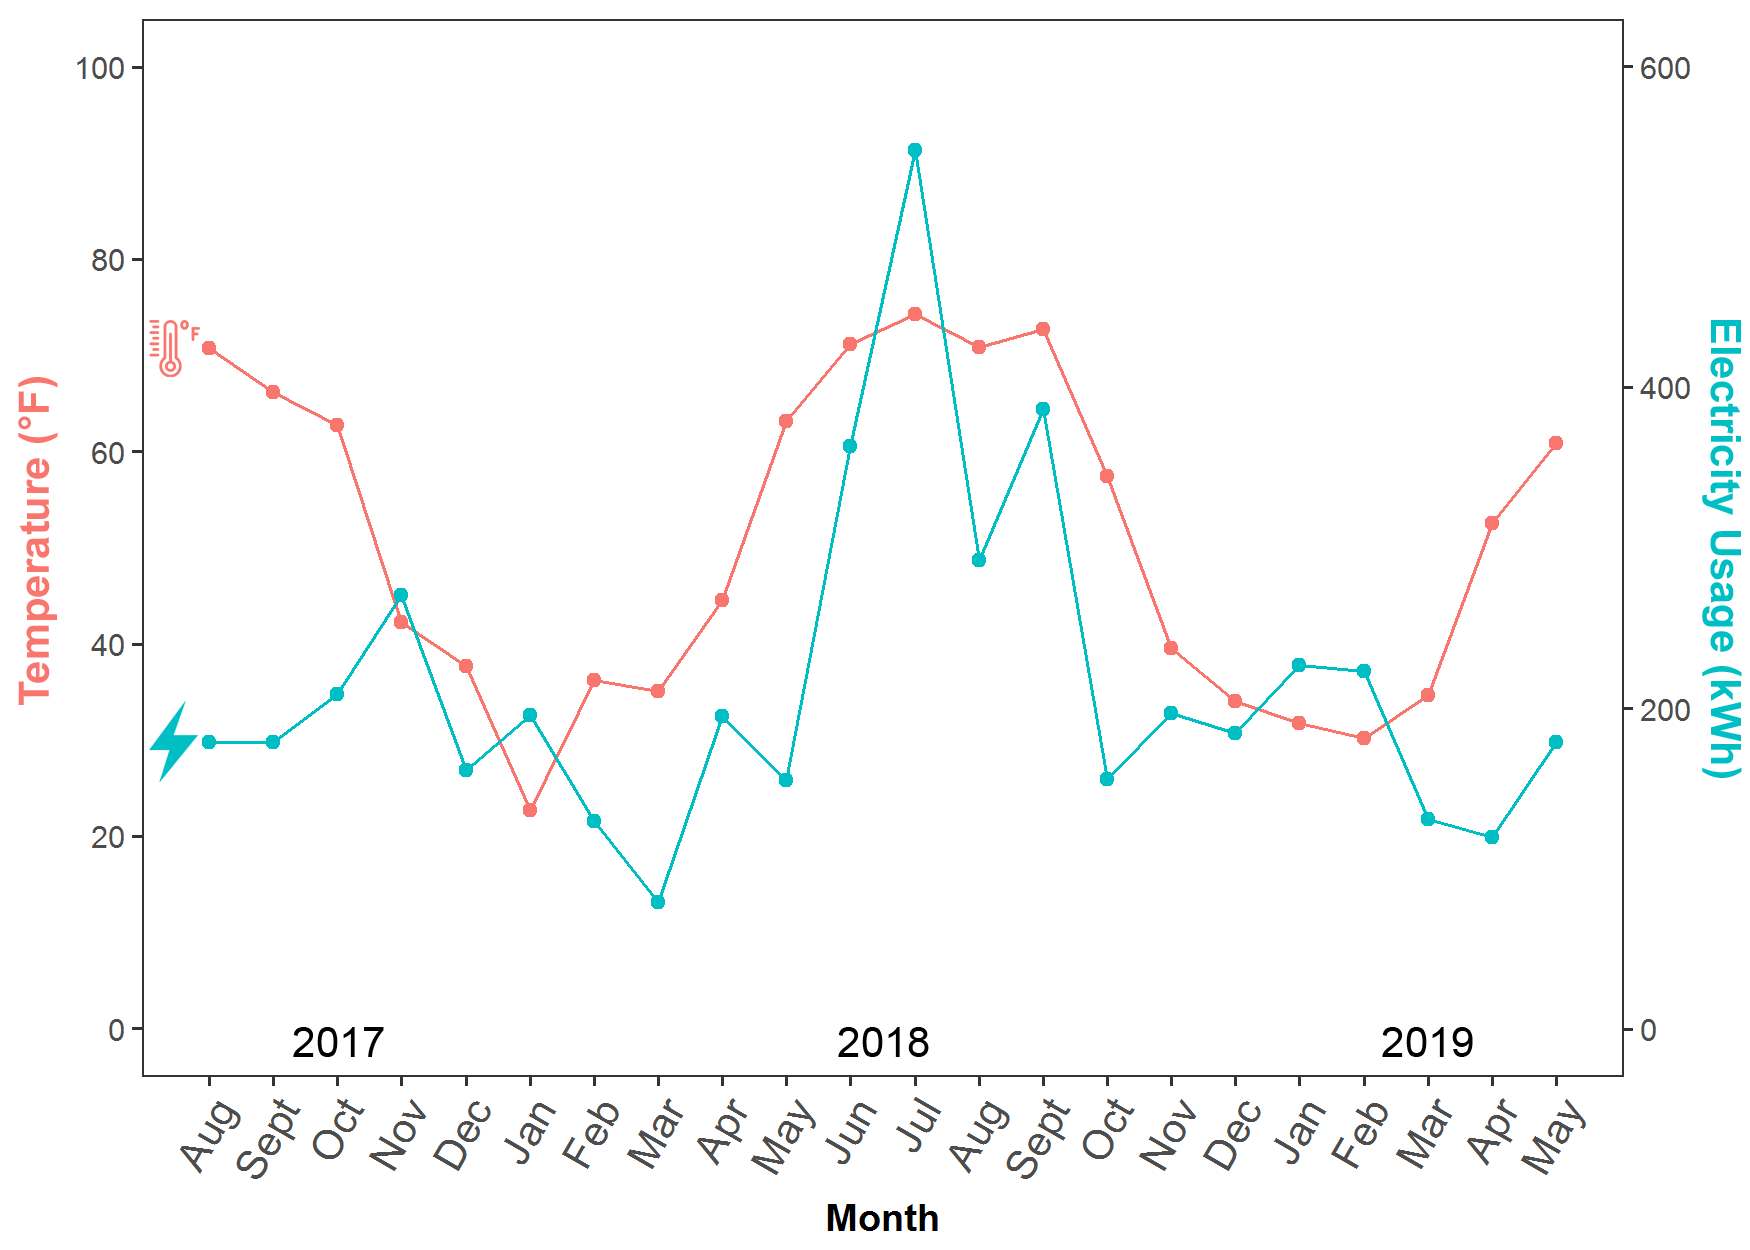
The relationship between electricity usage and weather.
Note: The red line represents average temperature (˚F) and the blue line represents electricity usage (kWh) for each billing period.
Note: The red line represents average temperature (˚F) and the blue line represents electricity usage (kWh) for each billing period.
You can see in the above figure that the lines for temperature and electricity have roughly the same shape. One of the interesting insights the figure offers is that high Pittsburgh temperatures really drive up my electricity usage, but the colder periods do not. I would have thought the use of my space heater in the winter would have a more pronounced effect (especially given that I’m a Southern California native living in a city with real winters). It’s possible the portable A/C unit is simply much more costly to run. Wearing warm clothes at home during the winter may also be contributing to this effect.
I’m aware that double y-axis plots can sometimes be misleading (see examples). However, I think these variables are reasonable to plot together for this purpose as there is a clear rationale for why a relationship exists between the two variables. Indeed when I examine the relationship between temperature and electricity usage I find a significant correlation, r = .52, p = .01.
The figure was created in R with minor aesthetic additions of the temperature and electricity symbols in photoshop.
Footnotes:
1 The billing period starts the last week of a month and continues until the end of the third week of the following month.
2 Source of weather data: https://www.ncdc.noaa.gov/cdo-web/datatools/records
3 Download Eletricity/Temperature dataset (.csv)